Exploratory Data Analysis With Python and Pandas
About this course
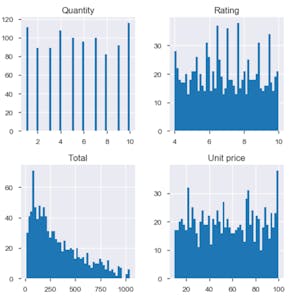
In this 2-hour long project-based course, you will learn how to perform Exploratory Data Analysis (EDA) in Python. You will use external Python packages such as Pandas, Numpy, Matplotlib, Seaborn etc. to conduct univariate analysis, bivariate analysis, correlation analysis and identify and handle duplicate/missing data. Note: This course works best for learners who are based in the North America region. We’re currently working on providing the same experience in other regions.
55/100
CourseAsk score
- What the provider tells you
- 31/45
- Who stands behind it
- 8/35
- How complete the listing is
- 16/20
Scores how much the provider publishes and who stands behind it — not how well it is taught.
What you'll learn
- perform univariate analysis with Pandas and NumPy
- conduct bivariate analysis and visualize relationships with Matplotlib and Seaborn
- calculate and interpret correlation matrices
- detect and handle duplicate records in a dataset
- identify and impute missing data using Python tools
Course objectives
- apply core Python data‑analysis packages to exploratory tasks
- build visualizations that reveal data patterns
- clean datasets by addressing duplicates and gaps
Price shown by Coursera — confirm on their site.
Enroll on CourseraYou'll be redirected to Coursera to complete enrollment.
- Listed & compared by CourseAsk
- English · 0
![[게임PM/PO]데이터분석과 관리자페이지 기획, 게임로그 설계 강의](https://i.udemycdn.com/course/480x270/6717667_fd06.jpg)
 Udemy
Udemy



 Coursera



Compared on these lists
Where this course ranks against the alternatives.