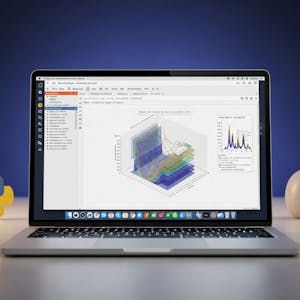
Jupyter & Python: Visualize, Optimize & Accelerate
About this course
Build Jupyter and Python skills for data visualization, notebook productivity, and high-performance computing. You’ll begin by configuring Jupyter Notebook and using IPython for markdown, calculations, documentation, and interactive code execution. You’ll then use Matplotlib and NumPy to create and customize line, scatter, histogram, bar, pie, and polar charts. As you progress, you’ll design scientific visualizations with annotations, multiple and logarithmic axes, date formatting, Mathtext, LaTeX rendering, contour plots, and image plotting. You’ll work with IPython magic commands, configuration options, HTML and JavaScript rendering, interactive widgets, kernels, and unit testing for reliable notebook workflows. Next, you’ll focus on Python performance optimization. You’ll convert notebooks to HTML and LaTeX, handle structured data with JSON, profile code, use memory mapping for large NumPy arrays, and create real-time interactive applications. Finally, you’ll accelerate Python with Numba, Cython, and C integration; execute asynchronous, parallel, distributed, and cluster-based computing; and explore advanced visualization with Seaborn, D3.js, and Julia. Designed for beginners learning Jupyter and practitioners improving data science, research, or analytics workflows, this course provides a path from setup and plotting to optimized, scalable computing. Enroll to create clearer visualizations, work efficiently in IPython, and improve data-driven application performance.
68/100
CourseAsk score
- What the provider tells you
- 32/45
- Who stands behind it
- 20/35
- How complete the listing is
- 16/20
Scores how much the provider publishes and who stands behind it — not how well it is taught.
What you'll learn
- configure Jupyter and IPython environments
- create professional data visualizations with Matplotlib
- enhance graphs using NumPy
- apply advanced scientific plotting techniques
- master IPython functionalities like widgets and magic commands
- optimize Python performance using profiling tools
- implement parallel and distributed computing
- explore next-generation visualization with Seaborn and D3.js
Price shown by Coursera — confirm on their site.
Enroll on CourseraYou'll be redirected to Coursera to complete enrollment.
- Listed & compared by CourseAsk
- English · 0

 Udemy
Udemy



 Coursera



Compared on these lists
Where this course ranks against the alternatives.